k-means++
What is k-means++?
Previously, I implemented k-means, and now, its improved version, k-means++, is introduced.
Compared to plain k-means, the only difference lies in the method of selecting initial centroids. However, this difference often leads to faster convergence and better results.
This method was proposed in the following paper published in 2007:
Arthur, D. and Vassilvitskii, S. (2007). “k-means++: the advantages of careful seeding”. Proceedings of the eighteenth annual ACM-SIAM symposium on Discrete algorithms. Society for Industrial and Applied Mathematics Philadelphia, PA, USA. pp. 1027–1035.
The paper can be found here.
This article explains the implementation of k-means++ and compares its results with plain k-means.
The repository remains the same as before:
https://github.com/hokacci/cluster/tree/main
Centroid Initialization in k-means
In plain k-means, centroid initialization is handled by the KMeans::init_centroids() function.
The code is as follows:
// Initialize centroids by selecting k points randomly from the dataset
void init_centroids()
{
std::random_device seed_gen;
std::mt19937 engine(seed_gen());
std::uniform_int_distribution<> distribution(0, m - 1);
std::vector<int> used_indices;
for (auto &¢roid : centroids)
{
// Avoiding duplication
int index;
do
{
index = distribution(engine);
} while (std::find(used_indices.begin(), used_indices.end(), index) != used_indices.end());
centroid = points[index];
used_indices.push_back(index);
}
}
The process is straightforward: k data points are randomly selected as centroids without duplication.
Centroid Initialization in k-means++
In plain k-means, if the randomly selected centroids happen to be clustered together, the algorithm is more likely to fail and require more iterations.
k-means++ improves this by making an effort to select initial centroids that are well-separated.
Specifically, the method assigns a discrete probability distribution to the data points, where the probability of selecting a point is proportional to the square of its distance from the nearest selected centroid.
The implementation is as follows:
void init_centroids_kmeans_plus_plus()
{
    std::random_device seed_gen;
    std::mt19937 engine(seed_gen());
    std::uniform_int_distribution<> uniform_distribution(0, m - 1);

    // Select the first centroid randomly
    int index = uniform_distribution(engine);
    centroids[0] = points[index];

    // The remaining centroids are selected using a probability distribution that favors points farther away from the already chosen centroids.
    // In this case, there's no need to consider duplicates (since the probability of selecting already chosen centroids is 0).
    for (int i = 1; i < k; ++i)
    {
        std::vector<double> dist2s(m);
        for (int j = 0; j < m; ++j)
        {
            double min_dist = std::numeric_limits<double>::max();
            for (int l = 0; l < i; ++l)
            {
                min_dist = std::min(min_dist, distance(points[j], centroids[l]));
            }
            dist2s[j] = min_dist * min_dist;
        }
        std::discrete_distribution<> distance_based_distribution(dist2s.begin(), dist2s.end());

        index = distance_based_distribution(engine);
        centroids[i] = points[index];
    }
}
The first centroid is chosen randomly, but subsequent centroids are selected based on the square of their distances from the closest previously chosen centroid.
The use of std::discrete_distribution simplifies this process.
In k-means, care is taken to avoid duplicates, but in this method, data points that have already been selected as centroids are assigned a probability of 0, so there’s no need to worry about duplicates.
Preparing for Performance Comparison
To evaluate the improvement in performance, exec_kmeans_plus_plus() is implemented in addition to exec().
Now they returns the number of iterations.
This enables us to compare them from the view point of the number of iterations.
// Execute k-means++ and return the number of iterations
int exec_kmeans_plus_plus()
{
    init_centroids_kmeans_plus_plus();
    update_labels();

    int i = 0;
    for (; i < max_iter; ++i)
    {
        update_centroids();
        bool updated = update_labels();
        if (!updated)
        {
            break;
        }
    }
    return i;
}
Next, I considered how to evaluate performance in terms of success or failure.
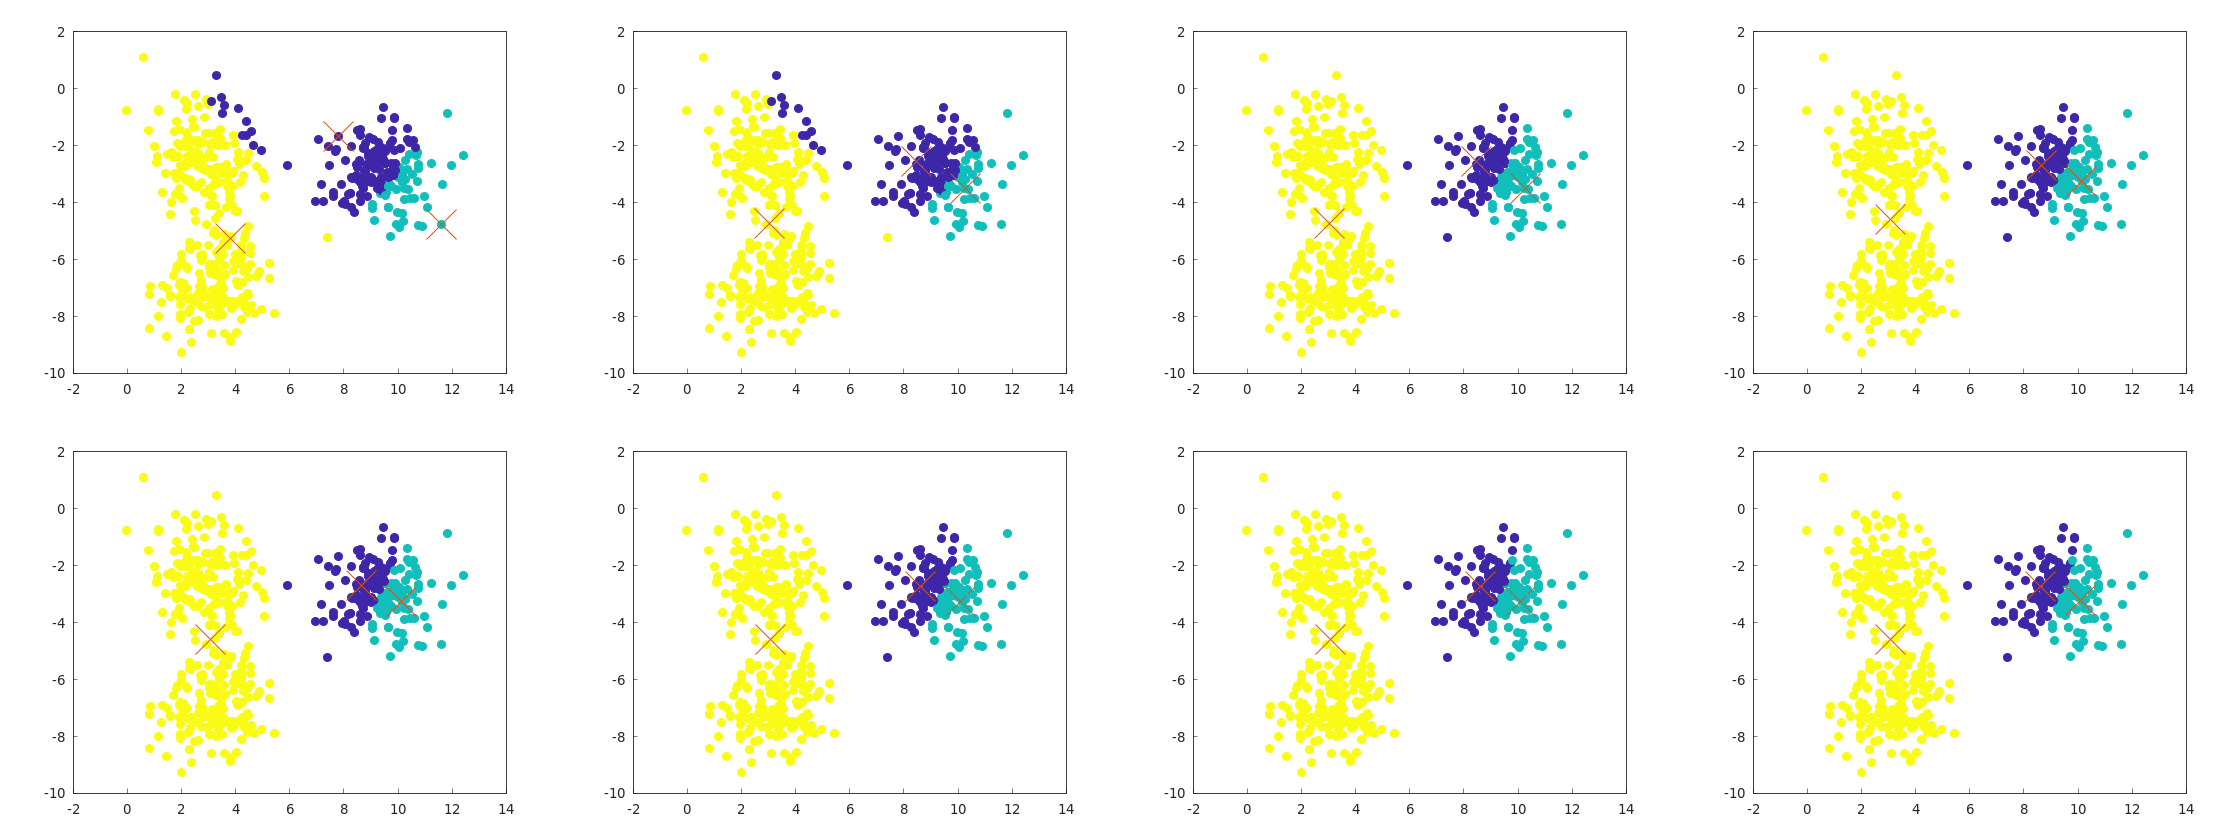
In the previous k-means implementation, I found that failure occurred approximately 1 in 5 times, as shown below.

On the other hand, no other failures occurred in multiple runs, so I decided to evaluate performance based on how often this type of failure occurs.
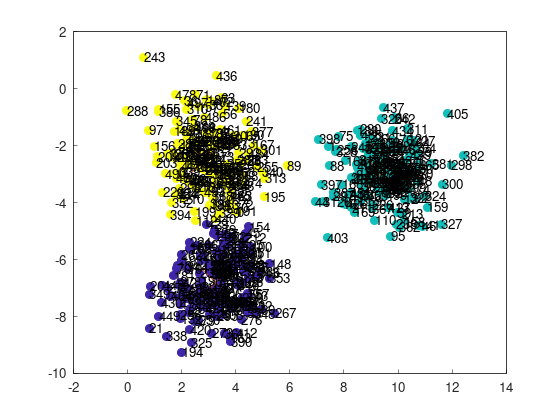
Here are the indices of the points:

To evaluate failure rates, we consider the following criteria based on the dataset:
- Point 243 (top-left) and point 21 (bottom-left) belong to separate clusters: Success
- Both points belong to the same cluster: Failure
Evaluating Performance Improvement
example/example_kmeans_plus_plus_blobs_2d.cppに性能比較のコードがある。
The performance comparison code is in example/example_kmeans_plus_plus_blobs_2d.cpp.
It runs plain k-means and k-means++ 100,000 times, counts the failure rate, and calculates the average number of iterations.
int main()
{
	yhok::cluster::KMeans kmeans(3, 100, dataset_blobs_2d);
	int n = 100000;

    // Run k-means n times and count the failures
	int count_failure = 0;
	int sum_iterations = 0;
	for (int i = 0; i < n; ++i)
	{
		int iterations = kmeans.exec();
		sum_iterations += iterations;

		if (kmeans.labels[243] == kmeans.labels[21])
		{
			++count_failure;
		}
	}
	std::cout << "Failure rate (k-means): " << count_failure / static_cast<double>(n) << std::endl;
	std::cout << "Average number of iterations: " << sum_iterations / static_cast<double>(n) << std::endl;

	// Run k-means++ n times and count the failures
	count_failure = 0;
	sum_iterations = 0;
	for (int i = 0; i < n; ++i)
	{
		int iterations = kmeans.exec_kmeans_plus_plus();
		sum_iterations += iterations;

		if (kmeans.labels[243] == kmeans.labels[21])
		{
			++count_failure;
		}
	}
	std::cout << "Failure rate (k-means++): " << count_failure / static_cast<double>(n) << std::endl;
	std::cout << "Average number of iterations: " << sum_iterations / static_cast<double>(n) << std::endl;

	return 0;
}
The results were as follows:
Failure rate (k-means): 0.1784
Average number of iterations: 3.92808
Failure rate (k-means++): 0.07242
Average number of iterations: 2.65308
The failure rate dropped from 17.8% to 7.24% (success rate increased from 82.2% to 92.7%), and the average number of iterations decreased from 3.92 to 2.65, confirming performance improvements in both aspects.
Of course, the results may vary depending on the dataset, but this shows the effectiveness of k-means++.